Solar Panel Cost in California 2026: Installed Prices, Net Billing, and Payback
California solar costs about $2.52 per watt installed in October 2026 (EnergySage), or roughly $15,103 for 6 kW before incentives. The federal residential credit no longer applies to 2026 installs, exports are paid at low avoidedcost rates under net billing, and the state property tax exclusion ends for systems completed after December 31, 2026.
Quick Checks
- 1Budget about $2.52 per watt installed in California in late 2026: roughly $15,103 for 6 kW, $20,137 for 8 kW, and $25,172 for 10 kW before incentives (EnergySage, October 2026).
- 2Do not subtract a 30 percent federal credit from a 2026 quote. The IRS states the residential clean energy credit is not available for property placed in service after December 31, 2025.
- 3Under net billing, exported solar is worth far less than imported power. Self-consumption and evening load shifting now decide payback more than system size does.
- 4Complete the system before January 1, 2027 if you can. California's section 73 property tax exclusion covers systems completed before that date and then lasts until the home changes ownership.
- 5If your household is income-eligible, ask about SGIP equity incentives before signing. The CPUC program lists up to $3,100 per kW of solar and $1,100 per kWh of storage for qualifying low-income customers.
Solar Panel Cost in California 2026: Installed Prices, Net Billing, and Payback
By EnergyBS Editorial Team | October 2, 2026
The Short Answer: What Solar Costs in California
Short Answer: In October 2026, a residential solar system in California costs about $2.52 per watt installed, based on EnergySage marketplace quote data. That puts a typical 8.41 kW system at about $21,178 before incentives, with a typical market range of $18,001 to $24,355. At the same per-watt rate, 6 kW costs about $15,103, 8 kW about $20,137, and 10 kW about $25,172.
The single biggest California-specific factor is no longer the sticker price. It is the export rate. Since April 15, 2023, new customers in Pacific Gas and Electric, Southern California Edison, and San Diego Gas and Electric territory interconnect under the CPUC net billing tariff, not legacy net energy metering. Power you use in the house offsets retail purchases. Power you send to the grid is credited at a much lower value-based rate. Two homes with identical $21,000 systems can see paybacks years apart purely because one uses most of its solar at noon and the other exports most of it.
Two timing facts belong at the top of any 2026 California decision. First, the federal residential clean energy credit is gone for systems you buy and have placed in service in 2026. The IRS page is explicit: the credit covers property installed from 2022 through December 31, 2025, and is not available for any property placed in service after that date. Second, California's property tax exclusion for solar has a completion deadline of January 1, 2027. A system completed before that date keeps the exclusion until the property changes ownership. A system completed after it does not get the exclusion under current law. Neither fact should stampede you into a bad contract, but both belong in the quote comparison.
1. The Installed Cost Stack: 6, 8, and 10 kW
Cost per watt is the cleanest way to compare California quotes because system sizes vary. EnergySage's October 2026 California data reports an average of $2.52 per watt including installation. The size table below applies that verified rate. It is a market average, not a quote. Steep roofs, tile roofs, long wire runs, main panel upgrades, and battery add-ons move a real quote off this line.
| System size (DC) | Gross installed cost at $2.52/W | What this size usually fits |
|---|---|---|
| 6 kW | $15,103 | Smaller homes, lower annual use, partial offset with high self-consumption |
| 8 kW | $20,137 | Near the California average system size of 8.41 kW in the same data set |
| 10 kW | $25,172 | Larger homes, EV charging, heat pump loads, or planned electrification |
Source for all three prices: EnergySage California Solar Panel Cost page, October 2026 data, opened for this guide. The same page lists 6 kW at $15,103, 8 kW at $20,137, and 10 kW at $25,172, which matches the $2.52 per watt average after rounding.
Read the table with three cautions. First, per-watt pricing usually falls slightly as systems get larger, because permitting, design, and mobilization costs spread over more watts. A 10 kW quote at exactly the 6 kW per-watt rate may have room to negotiate. Second, California quotes increasingly bundle a battery. If a quote shows a much higher total, check whether storage, a panel upgrade, or roofing work is inside the number before comparing it to a solar-only average. Third, financing changes the real cost. A low monthly payment built on a long, high-fee loan can cost more over its life than a higher cash price. Our solar quote comparison worksheet walks through separating equipment cost from financing cost line by line.
For statewide context on how California compares with other states, see our solar panel cost by state 2026 data guide. Then come back here, because California's export rules make national averages a poor guide to payback.
2. What Happened to the Federal Tax Credit
This is the point where many 2026 California quotes go wrong. For years, homeowners subtracted 30 percent from the gross price and called the result the net cost. That arithmetic relied on Internal Revenue Code section 25D, the residential clean energy credit. The IRS states the current rule plainly: the credit equals 30 percent of the cost of qualified clean energy property installed anytime from 2022 through December 31, 2025, and the credit is not available for any property placed in service after December 31, 2025.
What that means in practice:
- A homeowner-owned system completed and placed in service on or before December 31, 2025 could still claim the 30 percent credit under the old rule, subject to tax liability and carryforward rules. That is a 2025 tax-return question, not a 2026 discount.
- A homeowner-owned system placed in service in 2026 gets no section 25D credit. If a 2026 proposal subtracts 30 percent as a federal tax credit for a cash or loan purchase, the net price on that page is wrong. Ask the installer to reissue the quote with the credit removed.
- Leases and power purchase agreements are different. Under those structures a company owns the system and may claim a commercial credit, then reflect some of that value in the lease or PPA price. The homeowner does not claim the credit personally. Compare a lease on its own contract terms, escalators, and buyout rules, not on a tax credit you will never file for. Our buying vs. leasing solar and PPA guide covers how to read those contracts.
The credit change also explains a financing risk worth checking. Many solar loans were sized on the assumption that the borrower would pay roughly 30 percent of the balance down within the first year or so, often from the expected tax credit, and keep a lower payment after re-amortization. With no credit on a 2026 install, that lump sum has to come from somewhere else or the payment resets higher. If you finance, get the payment schedule with and without any voluntary principal payment, in writing, before you sign.
None of this makes solar pointless in California. It makes the honest starting price the gross price, and it puts the burden on production, self-consumption, and rate design to carry the payback. Sections 4 and 5 do that math openly.
3. California Incentives That Genuinely Exist in 2026
California has no state income tax credit for residential solar to replace the federal one. Anyone advertising a California state solar tax credit for a 2026 home purchase is describing a program that does not exist. What does exist is narrower, and each item below needs an eligibility check at your address.
Property tax exclusion (Revenue and Taxation Code section 73). California excludes the value of an active solar energy system from new construction assessment. In plain terms, adding solar does not add its value to your assessed value. The California Board of Equalization confirmed in Letter to Assessors 2024/031 that the exclusion applies to systems in progress or completed before January 1, 2027, and that a system excluded before the sunset stays excluded until the property changes ownership. For a system completed in 2026, the benefit repeats every year you own the home. It is not cash back, but in a state where most other improvements raise the assessment, it is real money over a long ownership. If your project might slip into 2027, get the completion and permission-to-operate timeline in the contract and ask your county assessor how completion is documented.
SGIP equity incentives for income-eligible households. The CPUC Self-Generation Incentive Program is mostly known as a battery program, and its general-market residential storage steps have filled and refilled over the years, so availability changes. The clearest current residential offer is the Residential Storage and Solar Equity budget. The CPUC announced in May 2025 that eligible low-income customers, defined as at or below 80 percent of Area Median Income or verified through programs such as CARE, FERA, or the Energy Savings Assistance program, can receive up to $1,100 per kilowatt-hour of storage and $3,100 per kilowatt of solar, with a standard single-family package sized around a 5 kW solar system and 15 kWh battery, and larger amounts requiring load justification. That is a targeted equity program, not a general rebate. If you think you qualify, start with the CPUC or your utility program administrator and an approved developer, and confirm budget availability before counting the money in your payback.
Utility and community choice aggregator programs. Some municipal utilities and community choice aggregators run their own solar or storage offers, and customers of Los Angeles Department of Water and Power or Sacramento Municipal Utility District are not on the CPUC net billing tariff at all. Their export and program rules differ. Do not import a PG&E, SCE, or SDG&E assumption into a municipal utility quote. Check DSIRE and your utility directly for the program that applies at your meter.
What to do with rebate claims in a sales pitch. Ask for the program name, the administrator, the current budget status, and whether the incentive is reserved before installation or claimed after. A legitimate incentive has a paper trail before the panels go on the roof. Keep the reservation letter, the final invoice, and the permission-to-operate notice with your tax and home records.
4. Net Billing: Why Exported Solar Is Worth So Much Less
Under legacy net energy metering, exported kilowatt-hours earned bill credits at or near the retail rate. The grid worked like a free battery. The CPUC ended that arrangement for new applicants. The CPUC Customer Generation page states that since April 15, 2023, customers applying for interconnection take service on the net billing tariff under Decision D.22-12-056, and that compensation for excess generation exported to the grid is applied at a rate reflecting the value of that generation to the grid.
That value comes from the Avoided Cost Calculator. It varies by hour, month, and utility, and it is low when solar is abundant. Contemporary reporting on the decision put the average export value at roughly $0.08 per kWh, down from roughly $0.30 per kWh at retail under the old system, a cut of about 75 percent. Treat those two figures as the scale of the change reported when the tariff was adopted, not as your tariff. Your actual export credits print on your bill and follow your utility's current Avoided Cost Calculator values, which are updated over time and locked for a period based on your interconnection year. The direction, however, is not in doubt: midday exports earn a small fraction of what an imported kilowatt-hour costs on a time-of-use rate.
Three design consequences follow:
- Self-consumption is now the main savings engine. A kilowatt-hour your home uses directly avoids a retail purchase. A kilowatt-hour you export earns the low avoided-cost value. Running the dishwasher, water heater, pool pump, and EV charger while the sun is up is worth more than it was under net metering.
- Oversizing past your daytime load pays poorly. Extra panels that mostly export at low rates stretch payback. Size to annual use with a realistic daytime load plan, and be skeptical of designs that produce far more than the home can use or store.
- Evening rates decide the battery case. Time-of-use prices are highest in the late afternoon and evening, after solar output fades. Stored solar used at 7 p.m. avoids the most expensive imports of the day. That is the economic core of the battery question in section 6.
If you are comparing a solar proposal, require the production estimate to split expected self-consumed and exported energy, month by month if possible. A single annual kilowatt-hour number hides the exact thing net billing changed. Our solar production estimate PVWatts guide shows how to sanity-check production claims with the free NREL tool before you trust a savings projection.
5. A Worked Payback Example With Every Input Labeled
Installer payback claims often bury their rates. The example below labels every input as hypothetical, so you can swap in your bill, your quote, and your utility tariff. It uses the verified California average price for the system cost and clearly hypothetical inputs for everything else. It ignores financing costs, maintenance, panel degradation, and future rate changes, and says so.
System (verified market input): 8 kW system at $2.52 per watt = $20,137 gross. No federal credit in 2026. No state cash incentive assumed. Net cost used here: $20,137.
Hypothetical inputs (illustration only, not a forecast):
- Annual production: 11,200 kWh (labeled hypothetical; equals 1,400 kWh per kW per year)
- Share used directly in the home: 45 percent (labeled hypothetical)
- Share exported: 55 percent (labeled hypothetical)
- Retail import price avoided by self-consumed solar: $0.35 per kWh (labeled hypothetical)
- Export credit: $0.06 per kWh (labeled hypothetical, inside the low avoided-cost pattern described in section 4)
Year-one bill savings math:
- Self-consumed: 11,200 x 0.45 = 5,040 kWh x $0.35 = $1,764
- Exported: 11,200 x 0.55 = 6,160 kWh x $0.06 = $370 (rounded)
- Total year-one savings: about $2,134
Simple payback: $20,137 / $2,134 = about 9.4 years, before rate escalation, degradation, and any added costs.
Now change only the self-consumption share to 70 percent, which is what load shifting and a right-sized system aim for:
- Self-consumed: 7,840 kWh x $0.35 = $2,744
- Exported: 3,360 kWh x $0.06 = $202 (rounded)
- Total: about $2,946
- Simple payback: $20,137 / $2,946 = about 6.8 years
Same panels, same price, same sun. The payback moved by more than two and a half years on one behavioral and design assumption. That is the honest California lesson: under net billing, when you use the power matters almost as much as how much you make. Any quote that promises a payback without stating its self-consumption, import rate, and export rate assumptions has not shown you its work. Ask for those three numbers and rerun this arithmetic with your last twelve months of usage.
For a deeper timeline treatment, including rate escalation and degradation, read our solar panel ROI timeline for 2026 after you have your own inputs.
6. The Battery Question in California
California is the state where the battery question is most serious, because net billing made midday exports cheap and evening imports expensive. A battery does three things: it raises self-consumption by storing noon surplus for evening use, it shifts load away from the highest time-of-use hours, and it provides backup during outages, including wildfire-related public safety shutoffs in some areas. Only the first two show up in simple payback math, and even those depend on your rate plan and usage pattern.
The battery is most likely to earn its cost when several of these are true: your home uses a lot of power between 4 p.m. and 9 p.m., your time-of-use spread between midday and evening is wide, you have an EV charging at home in the evening, your daytime home is empty so solar would otherwise export at low rates, or backup power has real value to you because of medical equipment, work, or outage history.
The battery is hardest to justify on bill savings alone when your home already uses most solar as it is produced, your evening load is small, or the quote bundles an oversized battery with a high financing charge. Storage also adds parts that can fail or need replacement sooner than panels. Compare usable kilowatt-hours, round-trip efficiency, warranty throughput, and backup panel scope, not just the headline capacity.
Cost context needs care. Battery prices in a quote are contract prices, not a state average we can cite the way we cite solar per watt. Get the storage portion priced as its own line. If you are income-eligible, price the SGIP equity route first, because the CPUC program listed in section 3 can cover a large share of storage cost for qualifying households. For everyone else, ask whether a smaller battery targeted at the evening peak beats a larger battery bought for rare multi-day outages.
Our home battery storage guide and solar battery economics breakdown work through sizing and the critical-load decisions in more detail.
7. Roof, Panel, and Permit Realities That Move the Price
The $2.52 per watt average assumes a straightforward job. California homes often add one of these cost movers:
- Main panel upgrade. Older 100-amp panels, crowded panels, or certain panel brands can require an upgrade before solar or storage interconnects. This is electrical work with its own permit. Get it as a separate line so you can tell whether the solar price or the house wiring is driving the total.
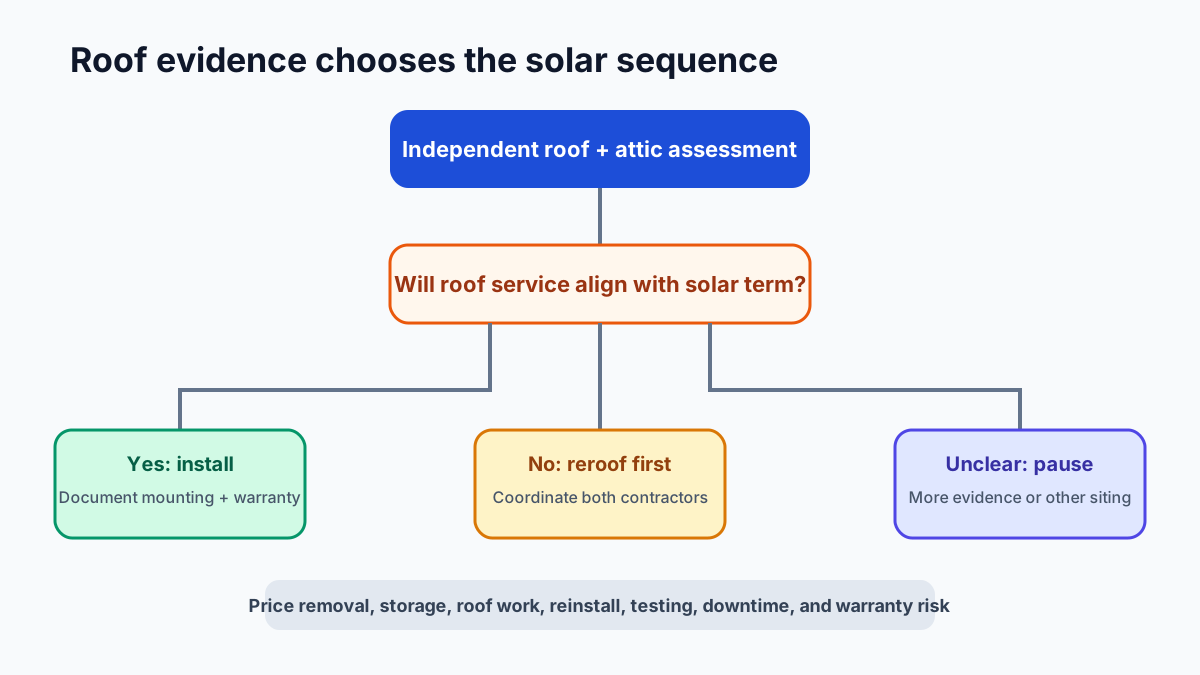
- Roof condition and material. Tile, steep pitch, multiple roof planes, and a roof near the end of its life all raise cost or argue for roofing work first. Putting new panels on a roof that needs replacement in five years creates a future remove-and-reinstall bill. Our replace roof before solar guide covers the sequencing decision.
- Permitting and interconnection timing. California has streamlined solar permitting in many jurisdictions, but timelines vary by city and utility. The property tax deadline in section 3 and any utility interconnection queue make schedule promises worth getting in writing, with a definition of completed that matches what the assessor and utility require.
- Shade and orientation. A shaded or north-facing array produces less, and under net billing it produces less of the self-consumed power that carries the savings. A smaller, clean, well-oriented system usually beats a larger shaded one.
None of these are reasons to accept a vague quote. Each should appear as a named line with a price, so you can challenge it or get a second bid on the same scope.
8. Quote Checklist for California Homeowners
Get at least three quotes on the same scope and compare them on this list:
- System size in kW DC, panel model and count, inverter type, and the gross cash price separated from any financing price.
- Annual production estimate with the tool and assumptions named, plus the expected split between self-consumed and exported energy.
- The exact utility tariff the savings claim assumes, the import rate, the export rate, and the self-consumption share. If any of the three is missing, the payback claim is incomplete.
- Confirmation in writing that no section 25D federal credit is subtracted for a 2026 homeowner-owned install, or a clear explanation if the offer is a lease or PPA owned by a third party.
- Battery scope if included: usable kWh, continuous power, backup loads panel included or not, and the storage price as its own line.
- Panel upgrade, roofing, trenching, or other house work as separate lines with separate prices.
- Incentive handling: program name, administrator, amount, who applies, and whether funds are reserved before install. For the property tax exclusion, the planned completion date relative to January 1, 2027.
- Warranties split into panels, inverter, battery, workmanship, and roof penetration, plus who honors each one.
- Payment schedule tied to milestones, never full payment before permission to operate.
Red flags: a net price that quietly assumes a 30 percent federal credit in 2026, a payback under five years with no rate assumptions shown, export income priced at retail rates, same-day signing pressure, or a lease escalator that outruns plausible utility rate growth without that risk being discussed.
Frequently Asked Questions (FAQ)
How much do solar panels cost in California in 2026?
EnergySage marketplace data for October 2026 puts the California average at $2.52 per watt installed. That is about $15,103 for 6 kW, $20,137 for 8 kW, and $25,172 for 10 kW before incentives. Your quote will vary with roof type, panel and inverter choice, electrical work, and whether a battery is included.
Is there still a federal solar tax credit for a 2026 installation?
No, not for a homeowner-owned system placed in service in 2026. The IRS states the residential clean energy credit applies to property installed from 2022 through December 31, 2025 and is not available for property placed in service after that date. Leases and PPAs owned by a solar company follow different commercial credit rules, priced into the contract by the owner.
What does net billing pay for exported solar in California?
Exports are credited under the CPUC net billing tariff at values from the Avoided Cost Calculator, which vary by hour, month, and utility and are far below retail import rates. Reporting on the tariff change put the average near $0.08 per kWh compared with roughly $0.30 per kWh at retail under legacy net metering. Check your utility bill and interconnection agreement for the values that apply to your system.
Does California offer a state solar tax credit or rebate?
There is no California state income tax credit for residential solar. The main statewide benefits are the section 73 property tax exclusion for systems completed before January 1, 2027, targeted SGIP equity incentives for income-eligible households, and any local utility or community choice aggregator program at your address. Verify current status on DSIRE and with your utility.
Will solar raise my California property taxes?
Not if the system is completed before January 1, 2027. Revenue and Taxation Code section 73 excludes active solar energy systems from new construction assessment, and the Board of Equalization confirms systems completed before that date stay excluded until the property changes ownership. Systems completed after the sunset do not get the exclusion under current law.
Do I need a battery with solar in California now?
Often it helps, but it is not automatic. Because exports earn low avoided-cost rates and evening imports are expensive, a battery that raises self-consumption can shorten payback, especially with high evening use or an EV. Homes already using most solar during the day may not recover the battery cost on bills alone. Price storage as a separate line and compare.
How long is the payback period for solar in California in 2026?
It depends mainly on self-consumption, your import rate, and the installed price. The worked example in this guide, using an $20,137 8 kW system and clearly labeled hypothetical rates, lands near nine years at 45 percent self-consumption and under seven years at 70 percent. Treat any single-number claim without stated assumptions as marketing, not math.
What to Read Next
- Solar Panel Cost by State 2026 Data Guide - how California pricing and policy compare nationally
- Solar Panel ROI Timeline 2026 - payback math with escalation and degradation
- Solar Quote Comparison Worksheet - compare three quotes on one scope
- Solar Production Estimate PVWatts Guide - check a production claim before you sign
- Is Home Battery Storage Worth It? - sizing storage for evening rates and backup
- Run your own system-size and savings scenarios with the solar calculators at CalculatorVillage.com once you have real quotes in hand.
Sources and Verification
- IRS Residential Clean Energy Credit: 30% credit for property installed 2022 through December 31, 2025; credit is not available for any property placed in service after December 31, 2025
- EnergySage California Solar Panel Cost (October 2026 marketplace data): average $2.52/W installed; 8.41 kW average system $21,178, range $18,001$24,355; 6 kW $15,103, 8 kW $20,137, 10 kW $25,172
- CPUC Customer Generation: net billing tariff (NBT) applies to customers applying for interconnection since April 15, 2023 under Decision D.2212056; exported energy is credited at a rate reflecting its value to the grid, unlike legacy net energy metering at retail rates
- pv magazine USA California net billing: average export rate cut from about $0.30 per kWh to about $0.08 per kWh under the avoided cost approach, effective April 2023
- California Board of Equalization, Letter to Assessors 2024/031 (August 26, 2024): Revenue and Taxation Code section 73 active solar energy system new construction exclusion applies to systems in progress or completed before January 1, 2027; excluded systems stay excluded until a change in ownership
- CPUC (May 29, 2025) SGIP Residential Storage and Solar Equity program: eligible lowincome customers (at or below 80% Area Median Income or enrolled in CARE, FERA, ESA or related programs) can receive up to $1,100 per kWh of storage and $3,100 per kW of solar
- DSIRE Database of State Incentives for Renewables and Efficiency: crosscheck for current California solar and storage programs
Editorial Review
EnergyBS Editorial Team
EnergyBS publishes practical homeowner guides. Important program, product, and cost claims should be checked against the linked source and local project documents before you commit to work.
Related Guides
View All ArticlesSolar Quote Comparison Worksheet 2026 Tool (Guide & Data)
A sidebyside homeowner worksheet for normalizing solar cash prices, financed cost, equipment, production assumptions, roof scope, utility rules, warranties, and contract obligations.
Should You Replace the Roof Before Solar? A 2026 Analysis
A roofandsolar sequencing guide covering condition evidence, remaining life, removeandreinstall scope, warranties, structural and electrical coordination, and sidebyside lifecycle scenarios.
Solar Production Estimate Guide 2026 Tool (Guide & Data)
A homeowner method for independently checking quoted solar kWh using roof planes, tilt, azimuth, shading, DCtoAC ratio, system losses, weather variability, utility load data, and postinstallation verification.