Solar Production Estimate Guide: Rebuild a Quote With PVWatts and Utility Data
A homeowner method for independently checking quoted solar kWh using roof planes, tilt, azimuth, shading, DCtoAC ratio, system losses, weather variability, utility load data, and postinstallation verification.
The Short Answer
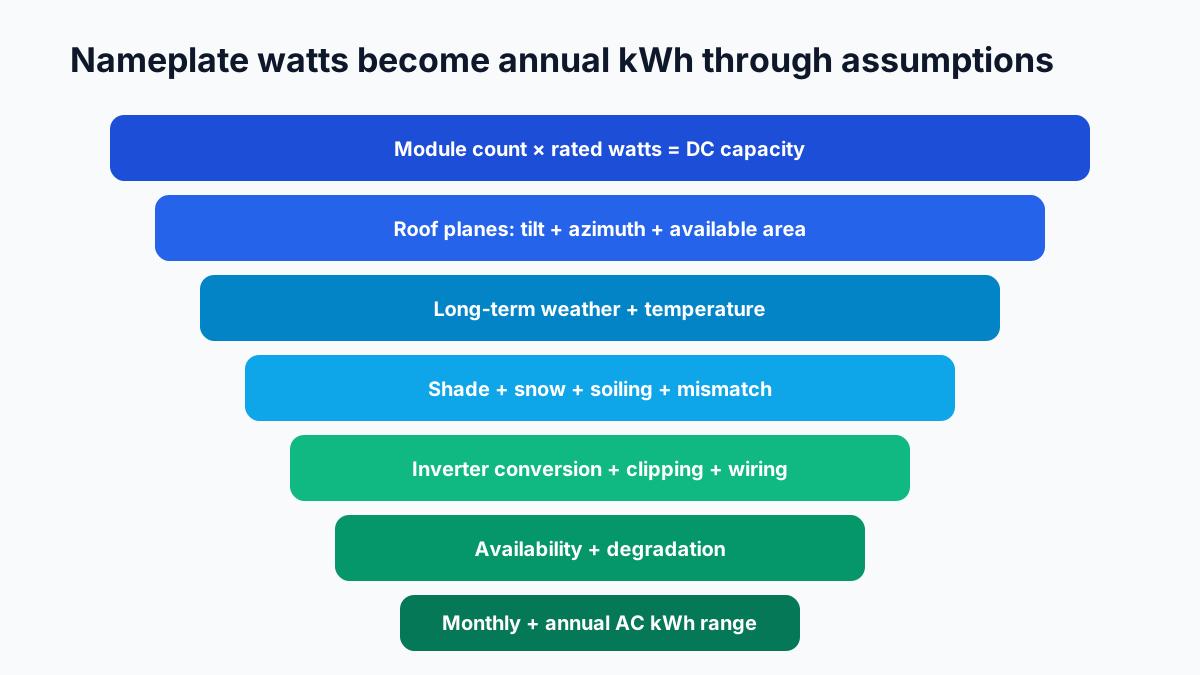
Short Answer: Rebuild a solar quote one roof plane at a time using the exact DC size, tilt, azimuth, inverter architecture, and a documented loss assumption. Compare the result with the installer's monthly kWh forecast, not just its annual total. Then apply shade, snow, soiling, clipping, degradation, downtime, and long-term weather as explicit ranges. Finally, compare hourly household load and the utility tariff to value self-consumed and exported energy separately.
NREL's PVWatts is a screening model, not a roof inspection or production guarantee. Its value is transparency: you can enter the same physical system across competing quotes and see whether a salesperson's output rests on a different roof plane, loss rate, weather file, or system size.
After installation, a model becomes the reference side of a diagnosis. If actual output falls outside a weather-aware range, use the solar underperformance evidence ladder to check missing monitoring data, curve shape, strings, shading, curtailment, and inverter events before buying cleaning or repairs.
This guide estimates energy. It does not decide structural suitability, electrical design, permit compliance, tax eligibility, or contract terms.
Collect the Minimum Inputs
From each quote, request:
- site address or model weather location;
- panel count and exact module watts;
- total DC system size in kW;
- inverter model and total AC capacity;
- modules assigned to each roof plane;
- roof-plane tilt;
- roof-plane azimuth;
- shade measurement method and result;
- system-loss percentage and components;
- annual and monthly AC kWh;
- first-year degradation treatment;
- DC-to-AC ratio;
- production guarantee, if any;
- one-line electrical diagram and layout.
From your records, collect:
- 12 to 24 months of utility kWh;
- hourly or interval load data if available;
- known new loads such as EV, heat pump, water heater, pool, or addition;
- roof plans or measurements;
- tree, chimney, dormer, and neighboring-building context;
- utility export and billing tariff.
Do not estimate a system solely from the dollar bill. Rates and fixed charges distort energy use.
Confirm the DC System Size
DC size in kW = panel count × panel rated watts ÷ 1,000
For 20 modules rated at 400 W:
20 × 400 ÷ 1,000 = 8.0 kW DC
Check every quote. A production estimate for 8.4 kW cannot be compared with a price for 8.0 kW. If substitute modules are allowed, production and layout must be updated before approval.
Panel count also affects roof fit. Higher-watt modules can be physically larger. Confirm dimensions, setbacks, access, and obstructions rather than assuming fewer panels always fit better.
Model Each Roof Plane Separately
PVWatts accepts a tilt and azimuth for a modeled array. A house with south, east, and west groups should not be represented as one “average” direction if precision matters.
For each plane, record:
| Plane | Modules | DC kW | Tilt | Azimuth | Shade/loss adjustment | Annual kWh |
|---|---|---|---|---|---|---|
| South | ||||||
| East | ||||||
| West | ||||||
| Other |
Run each plane, then sum monthly and annual AC production. This preserves the different morning, midday, and afternoon shapes.
Orientation value depends on tariff. A west-facing plane can produce less annually than an ideal south-facing plane but more during a valuable late-afternoon period. Energy yield and bill value are separate outputs.
Use the east-versus-west orientation guide to interpret timing.
Tilt and Azimuth Without Guessing
Tilt is the angle of the modules above horizontal. Azimuth describes compass direction under the model's convention. Verify whether zero means north or south in the tool being used; conventions differ.
Sources can include:
- roof plans;
- installer site measurements;
- inclinometer readings by qualified personnel;
- remote imagery as a preliminary estimate;
- survey or design software.
Do not climb a roof to measure it without training and fall protection. Satellite imagery can miss roof pitch, overhang, tree height, and recent changes. Mark remote inputs as provisional until the site survey.
Understand the Loss Stack
PVWatts includes a combined system-loss input. Treat it as a stack, not a mystery discount.
Possible components include:
- soiling;
- shading;
- snow;
- mismatch;
- wiring;
- connections;
- light-induced degradation;
- nameplate variation;
- availability or downtime;
- age;
- inverter conversion handled within model assumptions;
- clipping through DC-to-AC configuration.
Ask the installer for its loss table. If it uses a lower combined loss than the independent run, reconcile each component rather than accusing the model.
Avoid double counting. If a model already applies detailed shade loss, do not add the same shade percentage again in a generic loss field. PVWatts documentation should govern how advanced parameters are used.
Shade Is Time, Season, and Circuit Specific
Shade from a chimney at 9 a.m. differs from broad tree shade at noon. Deciduous trees change by season. Future growth and pruning permissions matter. Snow and leaf accumulation can create temporary shade.
Request:
- shade-access percentage or equivalent by roof plane;
- monthly or hourly shade impact where available;
- method: on-site instrument, lidar, drone, imagery, or software;
- horizon and obstruction model;
- assumptions about tree removal or trimming;
- shade impact on the chosen inverter architecture.
Optimizers and microinverters can reduce some electrical mismatch effects. They cannot create sunlight. Be skeptical when electronics are presented as eliminating physical shade loss.
If tree removal is proposed, evaluate ownership, permits, arborist risk, cooling shade, stormwater, privacy, habitat, and replacement. Solar production is not the only property value.
DC-to-AC Ratio and Clipping
DC-to-AC ratio = module DC kW ÷ inverter AC kW
An 8.0 kW DC array with a 6.4 kW AC inverter has a ratio of 1.25.
DC capacity above inverter AC capacity can be intentional. Modules rarely operate at nameplate under all field conditions, and a higher ratio can improve inverter utilization during lower-light hours. During strong conditions, AC output may clip at the inverter limit.
Do not judge from ratio alone. Compare:
- modeled annual clipping energy;
- module orientation diversity;
- temperature and solar resource;
- inverter efficiency curve;
- export or interconnection limit;
- battery coupling;
- future expansion;
- warranty and manufacturer design limits.
The quote should show why the selected ratio is economical, not merely say that clipping is normal or unacceptable.
Weather Is a Range, Not One Year
PVWatts uses long-term solar and weather data and reports an estimate, while actual annual output varies. Cloud, temperature, snow, smoke, storms, and unusual weather change results.
Use at least three output cases:
- lower-weather case;
- expected long-term case;
- higher-weather case.
Do not promise annual bill savings from the highest production year. For cash-flow planning, use the central or conservative case. A production guarantee's exclusions may also treat unusual weather separately.
The value of long-term data is not perfect prediction. It prevents one sunny recent year from becoming the permanent sales baseline.
Temperature and Module Output
Module output generally changes with cell temperature. Hot modules can produce less power than their standard-test rating even under strong sun. Cold sunny conditions can produce high power.
Record the module temperature coefficient and the model's thermal assumptions. Roof mounting, ventilation, climate, irradiance, and wind affect cell temperature. Do not apply a crude annual temperature deduction on top of a model that already simulates temperature-dependent performance.
This matters when comparing roof-integrated products, close-mounted arrays, and open-rack systems. Use the exact product and mounting model where available.
Snow, Soiling, and Maintenance
Loss varies by region and site.
Snow
Tilt, roof geometry, temperature, sun, drifting, lower-edge obstruction, and safe shedding area affect retention. Never recommend unsafe roof clearing to chase small winter production. Include a documented snow-loss range where meaningful.
Soiling
Rain, pollen, dust, wildfire residue, birds, agriculture, industry, and tilt influence soiling. Cleaning cost and safety can exceed recovered energy. Follow manufacturer guidance and use professional access when required.
Debris and animals
Leaves, nests, and wiring damage can affect output and safety. Guards and inspection need compatible installation that does not risk debris or violate warranties.
Availability
Inverter failure, communications failure, grid outage, curtailment, service delay, and monitoring gaps reduce delivered energy. A model with zero downtime is not a maintenance plan.
Degradation and Multi-Year Output
Module warranties commonly describe a performance path, but warranty thresholds are not necessarily the expected degradation forecast. Ask the quote to state:
- first-year change;
- annual degradation assumption;
- product-specific evidence;
- inverter or battery replacement assumptions;
- whether production guarantee uses the same schedule.
Multi-year estimate:
Year n production = first-year production × (1 − annual degradation)^(n − 1)
If the quote treats year-one production as constant for 25 years, its lifetime kWh is overstated. If it uses the warranty floor as expected output, it may be overly pessimistic. Show assumptions.
Read the solar degradation guide for component and interpretation details.
Worked Independent Estimate
Hypothetical design:
- 12 south modules at 400 W = 4.8 kW DC;
- 8 west modules at 400 W = 3.2 kW DC;
- total = 8.0 kW DC;
- installer forecast = 11,200 kWh first year.
Independent steps:
- Run the 4.8 kW south plane with measured tilt and azimuth.
- Run the 3.2 kW west plane separately.
- Use the documented inverter type and defensible loss stack.
- Adjust shade only once.
- Sum monthly AC kWh.
- Run lower and higher loss/weather cases.
Suppose the independent central result is 10,400 kWh, with a range of 9,700–10,900. The installer is 7.7% above the central result and above the independent high case.
Do not reject it automatically. Ask whether its site model has better roof geometry, a different weather dataset, measured shade, lower soiling, bifacial gain, or another supported input. Require a written reconciliation. If the explanation is only “our software is more accurate,” the assumption remains unresolved.
Compare Production With Household Load
Annual household kWh establishes a size reference, not economic value.
Adjust the load history for:
- EV purchase;
- heat-pump conversion;
- electric water heating;
- efficiency work;
- pool or hot tub;
- home addition;
- occupancy change;
- home business;
- expected retirement or work-from-home schedule;
- climate variation.
Create an hourly value bridge:
| Solar outcome | Energy | Utility treatment | Value method |
|---|---|---|---|
| Used instantly in home | Avoided import | Applicable retail marginal rate | |
| Exported | Export credit | Utility tariff | |
| Stored then used | Avoided import less losses | Rate spread and battery cost | |
| Curtailed | No bill value | Zero unless program says otherwise |
Do not value every solar kWh at the retail rate unless the tariff truly does so.
Utility Rules Can Dominate the Production Difference
Verify:
- net metering or net billing;
- export rate and time dependence;
- fixed and minimum charges;
- time-of-use periods;
- demand charges;
- system-size cap;
- annual true-up;
- credit expiration;
- interconnection cost;
- transformer or service upgrade;
- export limit or zero-export control;
- tariff transfer after a home sale;
- battery charging/export restrictions.
A 3% model difference can matter less than an incorrect export-rate assumption. Read the tariff or obtain written utility clarification.
Production Guarantee Audit
Compare the guarantee's kWh path with the forecast. Some guarantees start below the sales estimate or reimburse only a small amount.
Record:
- guaranteed kWh by year;
- weather adjustment;
- degradation;
- shade and soiling exclusions;
- outage and grid exclusions;
- monitoring requirement;
- maintenance requirement;
- claim deadline;
- remedy rate per missing kWh;
- repair obligation;
- transfer and provider solvency.
If the forecast says 10,400 kWh but the guarantee begins at 8,800, the marketing and contractual floors differ materially.
Post-Installation Baseline
At commissioning, save:
- as-built layout and equipment models;
- serial numbers;
- inverter AC capacity and settings;
- utility permission-to-operate date;
- monitoring owner access;
- meter and inverter readings;
- photos of every roof plane;
- shade report;
- commissioning tests;
- initial production model;
- warranties and service contact.
Production before permission to operate may be limited. Do not use an incomplete month as the baseline.
Monthly Performance Check
Compare measured AC production with the model's monthly profile, not annual average divided by 12. Solar seasons differ.
When production is low:
- confirm monitoring is measuring generation, not only export;
- check grid outage or curtailment history;
- check inverter or optimizer alerts;
- compare weather and snow;
- inspect safely from the ground for new shade, debris, or damage;
- compare strings or modules only if monitoring supports it;
- contact the provider with dates and screenshots;
- preserve warranty claim deadlines.
Do not climb the roof or open energized solar equipment. DC circuits can remain hazardous in daylight.
Common Modeling Errors
Using one roof direction for the whole array
Model distinct planes separately.
Applying shade twice
Know whether shade is already embedded in the model or loss stack.
Confusing DC system size and AC inverter size
Record both and calculate the ratio.
Using annual output without monthly shape
Monthly shape tests roof-plane and seasonal assumptions and improves tariff analysis.
Treating annual offset as bill savings
Value self-consumption, exports, fixed charges, and imports separately.
Ignoring future household loads
Build a documented load roadmap, but do not oversize for speculative appliances.
Assuming electronics erase shade
Module-level power electronics can manage mismatch; they cannot restore blocked sunlight.
Using one sunny year as expected forever
Use long-term weather and output ranges.
Run a Sensitivity Table Instead of One Perfect Model
An independent estimate becomes more useful when it shows which uncertain inputs matter. Keep system size, roof geometry, and equipment type fixed, then run a small set of controlled cases. Change one assumption at a time so the effect remains visible.
Use a table like this:
| Case | Shade/loss treatment | Weather view | Downtime | Purpose |
|---|---|---|---|---|
| Base | Best-supported inputs | Typical-year dataset | Normal allowance | Central planning estimate |
| Lower production | Credible higher losses | Typical-year dataset | Added service allowance | Conservative cash-flow case |
| Better production | Credible lower losses | Typical-year dataset | Normal allowance | Upside boundary, not promise |
| Weather check | Same as base | Alternate available weather basis | Normal allowance | Tests climate-data sensitivity |
Do not manufacture narrow confidence intervals from a handful of runs. PVWatts is a screening and planning model, not a site inspection or a guarantee. The sensitivity table is a transparent scenario range tied to explicit inputs.
If two quotes differ by 12% in predicted production, investigate before averaging them. Reconcile DC size, roof-plane allocation, azimuth convention, tilt, shade, system losses, inverter capacity, weather location, and first-year versus long-term treatment. A discrepancy often comes from definitions rather than superior equipment.
Rank uncertainties by their potential annual effect and whether they can be resolved before contract. Roof geometry can usually be measured. Equipment model numbers can be specified. Utility tariffs can be read. Tree growth, future obstruction, service downtime, snow persistence, and long-term weather are less certain. Spend diligence effort on large, resolvable uncertainties first.
Translate Annual Output Into a Monthly Cash-Flow Model
Annual kWh is not enough for bill analysis. Export compensation, time-varying rates, seasonal load, minimum bills, and battery operation can make two systems with the same annual production worth different amounts.
Build a twelve-row sheet with these columns:
- modeled solar production;
- household consumption from actual bills or interval data;
- solar used behind the meter;
- exports;
- imported energy;
- applicable energy and delivery rates;
- export credit;
- fixed or unavoidable charges;
- estimated bill with solar;
- actual bill later used for comparison.
If only monthly consumption is available, avoid pretending that all solar up to monthly load is self-consumed. Solar and load must coincide within the utility's settlement interval. A household can export at noon and import after sunset in the same month. Net metering may reconcile those flows; a net-billing tariff may value them differently.
Model a battery separately. A battery does not create energy. It shifts some production, consumes energy through conversion and standby losses, and may reserve capacity for backup. Ask what operating mode the quote assumes and whether the savings model uses tariff arbitrage, export avoidance, demand reduction, backup value, or several benefits that might not occur simultaneously.
For future loads such as an EV, heat pump, electric water heater, or addition, make a separate scenario rather than embedding them in current consumption. Estimate the new load's monthly shape and timing. This prevents a hypothetical future appliance from making today's solar quote appear to have a higher immediate self-consumption value.
Reconcile the Model With the Installer
Send the installer a one-page assumption sheet, not only your annual result. Include address or weather location, DC size, module type, array planes, tilt, azimuth, system losses, shade treatment, inverter capacity, weather basis, and estimated annual and monthly output. Ask them to identify every material difference from their proposal.
A useful response explains the model. It might show a higher-resolution shade study, a different roof measurement, module-specific behavior, or a more accurate electrical design. A weak response merely says the proprietary software is more accurate without disclosing inputs.
When a difference is justified, revise your independent case and record why. When it remains unresolved, carry both values into the financial comparison. Use the lower supported production for a cautious case and treat the difference as risk—not as an invitation to choose whichever number produces the desired payback.
Ask for the final design model after site survey and before irreversible work. Sales-stage layouts often change after roof, structure, code setbacks, electrical equipment, or utility requirements are verified. If the array size or location changes, the production and financial case should be updated too.
Commissioning Measurements That Make the Forecast Useful
At handoff, retain the final as-built array map, equipment models and serial numbers, inverter settings where available to the owner, monitoring credentials, permission-to-operate date, and commissioning records. Confirm that every inverter or optimizer expected in monitoring is reporting and that array labels match physical roof planes.
Choose a clean baseline period after permission to operate. Compare measured output with the modeled monthly range while accounting for partial months, curtailment, snow cover, outages, and unusual weather. Do not diagnose a defect from a cloudy week or compare a partial month with a full-month estimate.
If production appears low, follow an evidence sequence:
- verify the monitoring period and data completeness;
- check system status, alerts, and communications;
- note snow, debris, new shade, outages, or curtailment;
- compare roof planes or inverter channels where available;
- normalize for weather using an appropriate method before asserting long-term underperformance;
- send the installer the data, dates, model basis, and observed difference.
This process turns the pre-purchase model into an operating reference. It also creates a clearer service request than saying the bill seems high, because bills combine solar production, household consumption, rates, exports, and fixed charges.
Quote Audit Checklist
- Exact DC size recalculated from modules.
- AC inverter capacity and DC-to-AC ratio recorded.
- Every roof plane modeled separately.
- Tilt and azimuth source documented.
- Shade method and seasonal effects documented.
- System-loss stack supplied with no double counting.
- Monthly and annual AC production supplied.
- Lower, expected, and higher cases created.
- Degradation included in lifetime output.
- Household load adjusted for credible changes.
- Self-consumption and exports valued separately.
- Utility tariff verified independently.
- Forecast and guarantee compared.
- Commissioning and monitoring records promised.
For a financial range, enter the corrected production and tariff data into Calculator Village's solar ROI and payback calculator.
Frequently Asked Questions
Is PVWatts accurate?
It is a useful independent screening model based on weather and system assumptions. Actual sites require accurate roof geometry, shade, equipment, losses, and commissioning. Treat output as a range, not a guarantee.
What is a good annual kWh per installed kW?
It varies widely by location, roof orientation, tilt, shade, weather, losses, and architecture. Use local modeling rather than a universal yield number.
Why is my installer's estimate higher than PVWatts?
It may use different weather, shade, losses, geometry, equipment, or modeling. Ask for an input-by-input reconciliation. The higher result is not automatically wrong, but it needs evidence.
Should east and west panels be modeled separately?
Yes when they occupy distinct planes. Their monthly and hourly production shapes differ, which can affect both annual energy and tariff value.
Does clipping mean the inverter is undersized?
Not necessarily. Some clipping can be an economic design tradeoff. Compare annual lost energy, ratio, orientation, inverter limits, and cost rather than one peak graph.
How much degradation should I assume?
Use product-specific evidence and state the first-year and annual assumptions. Do not confuse the warranty floor with expected output or hold production flat for decades.
Can solar eliminate my electric bill?
Usually not every charge. Fixed fees, imports, rate timing, weather, load growth, and export compensation remain. Model the bill under the actual tariff.
What to Read Next
Put the verified kWh into the solar quote comparison worksheet, then test roof suitability with the reroof-before-solar guide. Use the orientation guide for timing and the degradation guide for multi-year output.
Sources and Method
This guide uses NREL PVWatts and solar-resource documentation, DOE rooftop-potential guidance, and FTC requirements for written production and contract details. Worked systems are illustrative. Confirm local weather inputs, shade, tariff, equipment, electrical design, and commissioning for the actual property.
Sources and Verification
Editorial Review
EnergyBS Editorial Team
EnergyBS publishes practical homeowner guides. Important program, product, and cost claims should be checked against the linked source and local project documents before you commit to work.
Related Guides
View All ArticlesSolar Quote Comparison Worksheet: Price, Production, Financing, and Contract Checks
A sidebyside homeowner worksheet for normalizing solar cash prices, financed cost, equipment, production assumptions, roof scope, utility rules, warranties, and contract obligations.
Best Solar Panel Direction: Azimuth and Tilt Guide (2026)
The old rule was 'South Facing Only'. But with TimeofUse rates and cheap panels, facing panels East and West might actually save you more money.
Solar Panel Degradation: How Long Do Panels Last? (2026)
Warranties say 25 years. Reality says 40. Here is the actual data on how panels age, fail, and keep producing power long after you've paid them off.