Solar Panels Underperforming? Prove the Loss Before Paying for Repairs
A weatheraware method to separate low sunlight, monitoring gaps, clipping, shade, soiling, inverter faults, string failures, curtailment, and billing confusion.
Direct Answer
A weatheraware method to separate low sunlight, monitoring gaps, clipping, shade, soiling, inverter faults, string failures, curtailment, and billing confusion.
Quick Checks
- 1Compare monthly energy with a weather-aware expectation; one cloudy day cannot prove a fault.
- 2Confirm that the monitoring portal, inverter meter, and utility meter are measuring the same boundary before comparing numbers.
- 3Do not open rooftop connectors, inverter covers, combiner boxes, or energized equipment yourself.
A Low Number Is a Clue, Not a Diagnosis
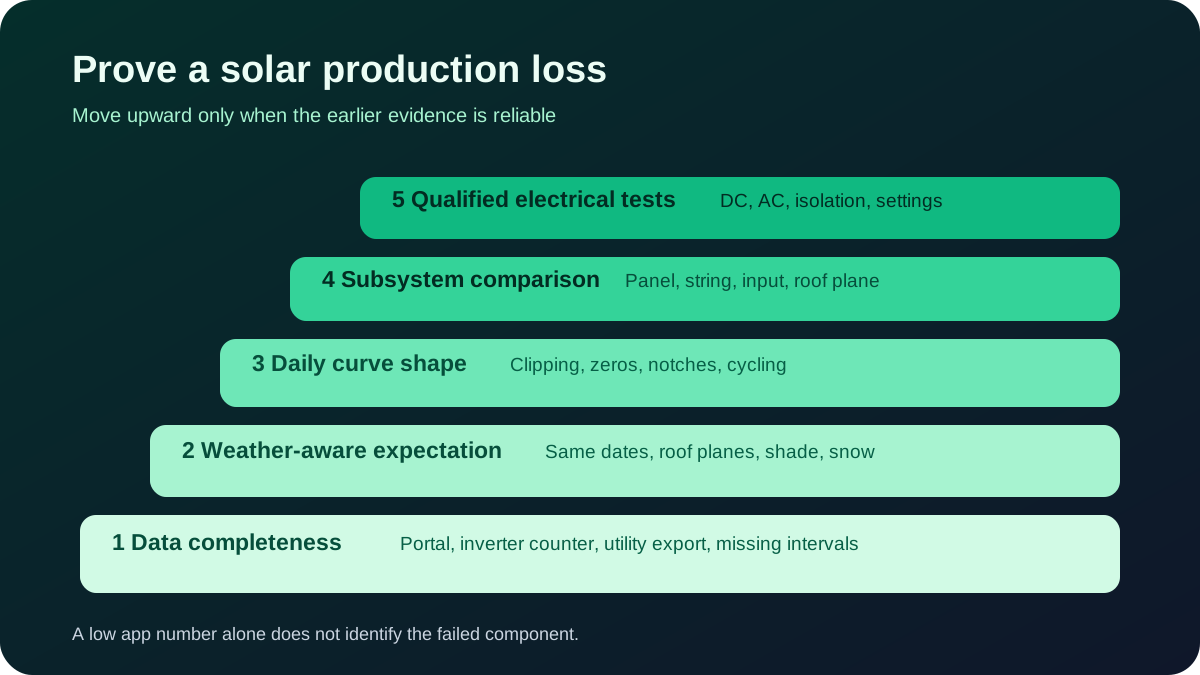
Short answer: Treat solar underperformance as proven only after actual AC energy is compared with a weather-aware expectation for the same dates and system. First confirm that the monitoring data are complete. Then compare daily curve shape, month-over-month energy, roof-plane or panel groups, inverter messages, utility exports, and visible site changes. Call the installer when the evidence shows a persistent, repeatable gap. Do not open energized solar equipment or climb the roof.
A 30% drop can mean a failed string. It can also mean a week of smoke, a monitoring gateway that stopped uploading, snow on one roof plane, a new tree shadow, utility curtailment, or a comparison with an unusually sunny prior year. The repair depends on which one happened.
Start With the Question You Need to Answer
Homeowners often mix four different complaints:
- The app shows less production. This may be generation loss or a data-upload problem.
- The bill is higher. Load, rates, fixed charges, credits, export rules, and production can all change the bill.
- Peak power is below panel nameplate. Temperature, inverter AC capacity, orientation, and clipping can make this normal.
- Annual energy missed the sales estimate. Weather, model assumptions, downtime, shade, and contract definitions matter.
Write the complaint as a measurable statement. “My solar is bad” cannot be tested. “The inverter portal recorded 612 kWh in June 2026 versus a weather-adjusted expectation of 865–940 kWh, and one string was at zero on every clear afternoon” gives a technician somewhere to start.
Stop and Call for These Conditions
Solar arrays can remain energized in daylight even when a breaker is off. Do not remove inverter covers, unplug rooftop connectors, open combiners, disconnect modules, probe DC conductors, or reset equipment repeatedly.
Call the installer, a licensed electrician qualified for the system, the utility, or emergency services as appropriate if you see or smell:
- smoke, arcing, melting, scorching, or burning odor;
- cracked electrical enclosures or exposed conductors;
- water inside electrical equipment;
- storm, animal, tree, fire, or impact damage;
- a ground-fault, insulation, arc-fault, isolation, or rapid-shutdown alert;
- a loose module, rack, conduit, or roof penetration;
- an inverter that is unusually hot, noisy, or cycling with a fault;
- a damaged battery or any battery warning.
Photograph from the ground when safe. Preserve alerts and timestamps. A power cycle may erase evidence, and a repeated reset can re-energize a fault.
When the change follows hail, wind, lightning, flood, fire, or tree impact, also preserve event and insurance evidence with the solar storm-damage workflow. Do not let non-emergency cleaning or removal erase the condition before the relevant parties inspect it.
Build a Reliable Baseline
Use the installer proposal, final design, commissioning report, warranty documents, and monitoring export. Record:
| Item | What to capture | Why it matters |
|---|---|---|
| Array | module count, watts, roof planes, tilt, azimuth | Establishes DC size and solar exposure |
| Inverter | model, AC rating, string or micro layout | Sets conversion and peak-power limits |
| Commissioning | date, initial readings, photos, tests | Shows what “working” looked like |
| Forecast | monthly and annual AC kWh | Gives the promised comparison, not just nameplate watts |
| Monitoring | interval, units, timezone, missing periods | Prevents a data gap from becoming a repair claim |
| Utility | import, export, net usage, meter change | Connects generation to billing without mixing boundaries |
| Site changes | trees, construction, roof work, dirt source | Explains new shade, disconnection, or physical damage |
If the original quote has only annual kWh, rebuild a transparent monthly estimate with the PVWatts production guide. Model each roof plane separately. Keep the original estimate too; it may define a contract or production guarantee.
Check Whether the Data Are Complete
A portal can lose internet access while the inverter keeps generating. Some systems backfill data after reconnection; others show a flat zero or gaps. Compare at least two independent records.
Possible records include:
- inverter or microinverter portal energy;
- inverter front-panel lifetime energy;
- revenue-grade production meter;
- utility export interval data;
- home energy monitor at the solar breaker;
- battery gateway solar input;
- commissioning or service reports.
These meters may not agree exactly because they sit at different electrical boundaries. The utility export meter sees only energy that leaves the home, not solar consumed instantly by the refrigerator, air conditioner, or EV. A battery can absorb solar before it reaches the utility. A portal may use inverter measurements rather than a separate meter.
A monitoring-gap example
The portal reports 320 kWh for a month. The inverter lifetime counter rose by 790 kWh. Utility data show normal midday exports on days the portal displays zero. That pattern supports a gateway or communications problem, not a 470 kWh generation loss.
Save screenshots before changing network settings. Note whether the app says “not reporting,” “offline,” or “not producing.” Those are different states.
Compare Energy, Not One Instantaneous Peak
Panel nameplate ratings use controlled test conditions. A 9.6 kW DC array is not expected to show 9.6 kW AC whenever the sky looks blue. Module temperature, sun angle, inverter size, wiring losses, haze, and roof-plane diversity affect instantaneous power.
Daily or monthly AC energy in kilowatt-hours is usually the better homeowner metric. Peak kilowatts still help when you use the shape and context.
Record for several clear days:
- sunrise and sunset;
- total daily kWh;
- maximum AC kW;
- time of maximum;
- curve shape;
- weather and temperature;
- alerts;
- panel, string, or roof-plane comparison if available.
Avoid comparing a cool, clear April day with a hot July day solely by peak power. Hot modules can deliver less power even with strong sunlight.
Normalize for Weather Before Calling It a Loss
The cleanest comparison uses measured plane-of-array irradiance and module temperature, but most homes do not have research-grade sensors. A practical screen can still reduce false alarms.
Use three views:
- Same month across several years. This exposes whether the current month is outside the home’s normal range.
- Model for the exact dates or a suitable weather comparison. Long-term PVWatts output is a baseline, not exact weather for this week.
- Nearby peer or weather evidence. Use only systems with similar orientation, shade, snow, and equipment; a neighbor’s south roof is not a control for your shaded west roof.
Create an expected range rather than one key efficiency number. If a modeled July is 1,150 kWh, a sensible screen might test lower, central, and higher weather cases. The exact band depends on available solar-resource data and the model’s uncertainty.
Simple performance index
For the same reporting period:
Performance index = actual AC energy ÷ weather-aware expected AC energy
If actual energy is 760 kWh and the adjusted expectation is 950 kWh:
760 ÷ 950 = 0.80
That is a 20% gap to investigate. It is not proof that the panels lost 20% of their capacity. The expectation, meter completeness, downtime, and site conditions still need review.
Read the Daily Curve Like a Timeline
Curve shape often narrows the cause faster than an annual total.
| Curve pattern | Possible explanation | Next evidence |
|---|---|---|
| Smooth flat top near inverter AC rating | Intentional clipping or export cap | Design DC/AC ratio, inverter limit, utility setting |
| Sharp zero during the day | Grid outage, inverter trip, communications gap, shutdown | Event log, utility outage, independent meter |
| Repeated on/off sawtooth | Grid voltage, thermal derating, fault reset, control issue | Timestamped error codes, voltage and temperature tests |
| Morning notch every clear day | Chimney, tree, dormer, roof-plane shade | Sun-path photo and panel map |
| One panel or micro consistently low | Shade, debris, module, connector, microinverter, mapping error | Neighbor-module comparison and qualified testing |
| One whole string at zero | String circuit, isolator, fuse, connector, input, or mapping fault | Installer electrical tests |
| Broad seasonal decline | Weather, snow, soiling, new shade, degradation, downtime | Monthly normalization and site history |
| Portal zero but utility exports continue | Communications or portal issue | Gateway/network and local meter records |
“Possible” matters. A graph does not authorize rooftop electrical work.
Clipping Is Not Automatically Underperformance
DC-to-AC ratio = array DC kW ÷ inverter AC kW
An 8.0 kW DC array on a 6.4 kW AC inverter has a ratio of 1.25. Under strong conditions the output can flatten at 6.4 kW. That can be an intentional design choice because modules spend much of the year below nameplate.
Judge clipping by annual energy and economics, not by the emotional impact of a flat graph. Ask for:
- modeled annual clipping kWh;
- roof-plane and orientation assumptions;
- export or interconnection limit;
- inverter manufacturer design limits;
- battery charging behavior;
- future expansion assumptions;
- alternative inverter size and cost.
The microinverter versus string guide explains the architectures. Do not accept a generic “1.25 is always ideal” rule; climate, orientation, equipment, tariff, and design all matter.
Shade Leaves a Repeatable Signature
Permanent obstructions tend to create a similar time-of-day loss on clear days. Seasonal trees change with leaf cover and sun angle. New construction may introduce a loss that did not exist in the original model.
From the ground, document:
- trees and recent growth;
- chimneys, vents, dormers, antennas, and new rooftop equipment;
- neighboring additions;
- debris or visible nesting;
- snow retention by roof plane;
- dates and times when the pattern appears.
Panel-level portals can help, but confirm the layout map is correct. A low rectangle in the app may be a swapped serial number rather than the module in that drawn roof position.
Electronics can manage some mismatch. They cannot make sunlight. Tree work also has property, permit, cooling, habitat, and safety consequences. Use an arborist and respect ownership boundaries.
Soiling and Cleaning: Measure Before You Buy a Service
Dust, pollen, ash, bird deposits, agriculture, salt, and low tilt can reduce output. Rain often removes loose material, while some sites develop stubborn localized deposits.
Do not assume every low-output system needs cleaning. Compare energy before and after natural rain under similar conditions when possible. Ask a qualified provider to quantify the expected recovery and access cost.
Never walk on modules, use pressure washers, apply unknown chemicals, scrape glass, or work near roof edges. Follow the module manufacturer’s instructions. If cleaning requires roof access, use trained professionals with fall protection and compatible equipment.
A useful cleaning decision uses:
Annual recovered value = recovered kWh × value per kWh
If a safe professional cleaning costs $280 and a defensible estimate suggests 180 recovered kWh worth $0.18 each, the annual energy value is $32.40. Cleaning may still be justified for inspection or a severe localized deposit, but routine economic payback is weak in that example.
Snow, Smoke, Heat, and Seasonal Effects
Snow can cover one roof plane or clear unevenly. Do not climb or rake a roof without a manufacturer-approved method and safe access. Winter production is often lower, so the annual value of risky clearing may be small.
Wildfire smoke and haze can reduce available sunlight without leaving obvious dirt on the glass. Heat can reduce instantaneous module power. Long summer days may still yield high daily energy even with a lower noon peak.
Keep a short event log:
| Date range | Event | Production change | Recovery |
|---|---|---|---|
| Jan 12–17 | Snow cover | −85% daily | East plane cleared first |
| Jun 3–5 | Smoke advisory | −22% vs nearby clear baseline | Returned after air cleared |
| Aug 9 onward | New zero string | −31% persistent | Requires electrical diagnosis |
Transient environmental loss and persistent equipment loss should not be treated the same.
Inverter and Electrical Faults
The inverter event log is valuable. Export it before a technician visit. Record exact code, time, state, grid condition, and whether generation returned automatically.
Possible categories include:
- grid voltage or frequency outside allowed range;
- ground, insulation, arc, or isolation fault;
- DC input missing;
- thermal derating;
- fan or internal component fault;
- communications loss;
- rapid-shutdown or module-level communications issue;
- battery or export-control interaction;
- firmware or configuration change.
Do not decide from the code name alone. A grid-overvoltage message may involve utility voltage, conductor voltage rise, connection, configuration, or inverter measurement. A missing input may involve a string, connector, fuse, switch, module, or inverter channel.
The technician should follow the exact manufacturer service procedure and local electrical rules. If replacement is proposed, use the solar inverter replacement decision guide to compare repair, like-for-like replacement, repowering, warranty, compatibility, export settings, and lost-production cost.
Utility Curtailment and Export Limits
A healthy array may reduce output because of a fixed export cap, dynamic export program, high grid voltage, zero-export control, or battery state. Ask whether the design has:
- an inverter AC limit;
- a site export limit;
- a current transformer or revenue-meter control;
- a utility command or dynamic export setting;
- battery reserve or charge ceiling;
- a rule that solar shuts down during a grid outage.
Standard grid-tied solar usually does not power the home during an outage unless it has approved islanding equipment and a designed backup path. That safety shutdown is not underperformance.
Compare inverter generation with utility export. If generation is normal but export is low, household self-consumption or battery charging may explain the difference. If generation itself flattens at the export cap after house load is satisfied, control settings may be involved.
Your Bill Can Rise While Solar Works
Solar generation is only one part of a bill. Review:
- total household load;
- imported kWh;
- exported kWh;
- credit rate and expiration;
- fixed, demand, minimum, and non-bypassable charges;
- rate-plan change;
- estimated versus actual meter read;
- new EV, heat pump, hot tub, server, tenant, or cooling load;
- billing-period length;
- battery charging source.
Example: solar production stays at 900 kWh, but household use rises from 1,000 to 1,450 kWh after an EV arrives. Imports rise even though the array has no fault.
Use the electric-bill breakdown guide to reconcile energy and dollars. Do not use the bill alone to accuse a component.
Quantify the Lost-Production Cost
Repair urgency depends on how much energy is missing, its tariff value, season, warranty, and safety.
Lost energy = expected energy − actual energy
Lost value = missing self-consumed kWh × avoided import rate + missing exported kWh × export credit
Suppose 500 kWh is missing. You estimate that 60% would have served the home at $0.24/kWh and 40% would have exported at $0.08/kWh:
- self-consumed loss: 300 × $0.24 = $72;
- export loss: 200 × $0.08 = $16;
- total estimated loss: $88.
This calculation keeps a salesperson from valuing every missing kWh at the highest retail rate. It also helps compare a $350 service visit with waiting for a warranty appointment. Safety faults still require prompt action regardless of short-term energy value.
Build the Service Packet
Send one organized record instead of a long phone description:
- system address, owner, installer, and commissioning date;
- array DC size, inverter model and AC size;
- one-line diagram and panel/string map if available;
- exact problem statement and first observed date;
- monitoring CSV and screenshots;
- clear-day curve before and after the change;
- weather and site-event notes;
- inverter alerts and timestamps;
- utility interval or meter evidence;
- photos from safe ground locations;
- original monthly forecast and guarantee terms;
- requested outcome: remote review, warranty claim, site test, or written explanation.
Ask the provider to preserve test results in writing. Useful fields include DC voltage/current by input, AC output, insulation or ground test, firmware/configuration, thermal findings, shade observations, connector inspection, and corrected production.
If the result points to a covered component, workmanship issue, roof promise, or production guarantee, organize the next step with the solar warranty claim routing map rather than sending the same generic complaint to every provider.
Questions to Ask Before Approving a Repair
- What measured result proves the proposed cause?
- Is the problem generation, monitoring, metering, configuration, or billing?
- Which component and serial number is affected?
- Is labor, shipping, access, or lost production covered?
- Will the replacement change array capacity, export approval, warranty, or monitoring?
- Does the utility or authority require a new permit or interconnection review?
- What production should I expect after the work, and how will it be verified?
- What happens if the repair does not restore the missing kWh?
- Who owns the monitoring account and data after service?
Avoid a parts cannon. Replacing panels does not fix a dead gateway, and cleaning does not fix a missing string.
Frequently Asked Questions
How much solar underperformance is normal?
There is no universal percentage. Weather variability, model quality, shade, equipment, downtime, and measurement boundary set the range. A persistent weather-aware gap is more meaningful than a single cloudy day or a peak below nameplate.
Why does my solar app show zero while the house still has power?
Your home can be powered by the utility while solar is off. The app can also lose communications while the inverter still generates. Check the portal status, inverter display, independent meter, and utility data without opening equipment.
Should I clean the panels first?
Only when visible site conditions and measured evidence support soiling, and when cleaning can be done safely under manufacturer guidance. Rain, weather normalization, and before/after energy can show whether cleaning is likely to recover enough value.
Is a flat top on the production graph a bad inverter?
Not necessarily. A consistent flat top at the inverter AC rating may be normal clipping or an export limit. Unexpected flattening below the design limit, new cycling, or fault messages needs investigation.
Can the utility make my inverter shut down?
Grid voltage/frequency protection, interconnection settings, export controls, or utility programs can limit production. A qualified installer and the utility can distinguish a grid condition from wiring, configuration, or equipment faults.
Do solar panels degrade suddenly?
Normal age-related degradation is gradual. A sudden step change points more toward downtime, monitoring, shade, damage, a string or inverter issue, or a configuration change. Read the solar degradation evidence guide before applying a generic annual rate.
What to Read Next
If the evidence points to an aging or failed inverter, use the inverter replacement decision worksheet before accepting a like-for-like box swap or a full-system upsell.
About the Editorial Team EnergyBS reviews public technical guidance, system documents, utility records, and homeowner cost assumptions. This guide is a screening method, not authorization to work on energized solar equipment. Use qualified professionals and the exact manufacturer instructions.
Sources and Verification
- NREL: Best Practices for Operation and Maintenance of Photovoltaic and Energy Storage Systems
- NREL: PVWatts Calculator
- U.S. DOE: WAP Solar Frequently Asked Questions
- PNNL: Solar Photovoltaic Operations and Maintenance Best Practices
- Australian Government: Monitor Your Solar System
- FTC: Solar Power for Your Home
Editorial Review
EnergyBS Editorial Team
EnergyBS publishes practical homeowner guides. Important program, product, and cost claims should be checked against the linked source and local project documents before you commit to work.
Related Guides
View All ArticlesSolar Production Estimate Guide: Rebuild a Quote With PVWatts and Utility Data
A homeowner method for independently checking quoted solar kWh using roof planes, tilt, azimuth, shading, DCtoAC ratio, system losses, weather variability, utility load data, and postinstallation verification.
Solar Panel Degradation: How Long Do Panels Last? (2026)
Warranties say 25 years. Reality says 40. Here is the actual data on how panels age, fail, and keep producing power long after you've paid them off.
Microinverters vs. String Inverters: Compare Shade, Clipping, Service, Monitoring, and Battery Design
A roofspecific inverter comparison using shade and mismatch, DC/AC ratio, modulelevel electronics, monitoring ownership, service access, battery coupling, grid requirements, and a 25year replacement ledger.