Why Is My Electric Bill So High in Summer? A 60Minute Diagnosis
A billfirst troubleshooting workflow that separates price changes, billingperiod effects, weatherdriven cooling, baseload growth, pool and waterheating loads, and HVAC faults before money is spent.
The Short Answer
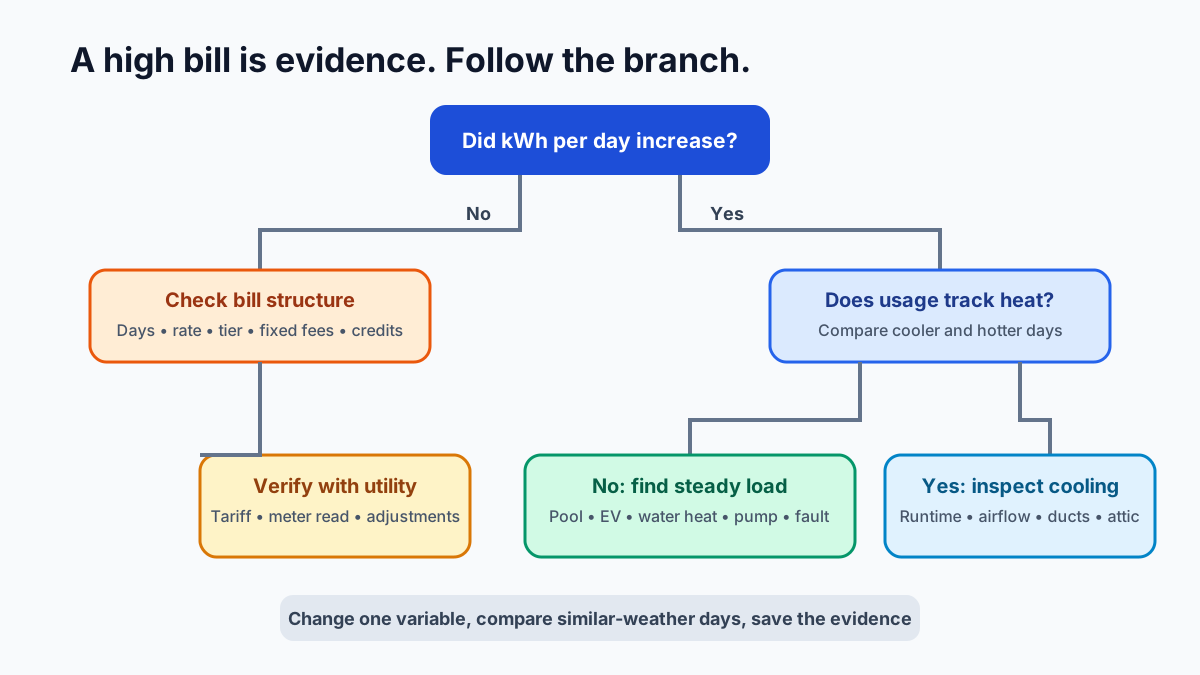
Short Answer: First compare kWh per day—not bill dollars—with the same period last year and a mild-weather baseline. Then separate a higher utility rate from higher consumption. If usage rose, check weather and thermostat runtime, then isolate steady baseload, cooling, water heating, pool or spa equipment, EV charging, and new appliances. A sudden unexplained 24-hour load or an air conditioner that runs without maintaining temperature warrants utility or qualified technical help.
A high bill is evidence, not a diagnosis. Replacing the air conditioner before checking billing days, rate tiers, estimated reads, weather, and baseload can turn a data problem into an expensive mistake.
This workflow can be completed in about an hour when the utility provides daily or hourly data. It prioritizes safe observation. Do not open electrical panels, bypass safety controls, handle refrigerant, or work on energized equipment.
The Four Ways a Bill Rises
Every bill increase comes from one or more of these:
- More billing days. A 33-day bill will be higher than a 28-day bill at the same daily use.
- Higher energy use. Cooling, pools, dehumidification, guests, EV charging, or a fault increased kWh.
- Higher price per unit. Supply, delivery, fuel adjustments, tiers, time-of-use periods, or taxes changed.
- New or changed fixed charges and credits. Customer charges, arrears, budget billing, solar credits, and assistance adjustments can alter dollars without matching current use.
Write those four headings before looking for an equipment failure.
Step 1: Normalize the Bill
Collect the current bill, the prior bill, the same month last year, and one mild-weather month.
Record:
| Field | Current | Same period last year | Mild month |
|---|---|---|---|
| Billing days | |||
| Meter read: actual or estimated | |||
| Total kWh | |||
| kWh per day | |||
| Usage-based charge per kWh | |||
| Fixed charges | |||
| Credits or adjustments | |||
| Average outdoor temperature or cooling degree days |
Calculate:
kWh per day = total kWh ÷ billing days
A bill rising from $180 to $220 looks like a 22% jump. If the periods changed from 28 to 34 days, daily cost moved from $6.43 to $6.47—almost no change.
Next calculate an effective bill rate for orientation:
effective dollars per kWh = total current charges ÷ kWh
This includes fixed charges, so it is not the marginal price of another kWh. Use it to spot a broad rate or fee shift, then read the tariff lines.
The electric-bill breakdown guide explains supply, delivery, riders, tiers, demand, and estimated reads.
Step 2: Split Price From Consumption
Create a simple bridge:
Bill change ≈ usage effect + rate effect + fixed/credit effect
Example:
- last summer: 1,100 kWh at $0.16 usage-based cost plus $25 fixed = $201;
- this summer: 1,300 kWh at $0.18 plus $30 fixed = $264.
Holding the old rate, the extra 200 kWh adds about $32. Applying the 2-cent rate increase to 1,300 kWh adds $26. Fixed fees add $5. The approximate $63 increase is split across usage, price, and fees.
EIA notes that electricity prices vary by locality, regulation, fuel costs, demand, and season and are often highest in summer. That explains why rates may change; your tariff proves whether they did.
If kWh per day is flat but dollars rose, focus on tariff, supplier, tier, and credit changes before investigating the air conditioner.
Step 3: Establish the Baseload
Baseload is the electricity the home uses without space cooling. Use a mild spring or fall month with similar occupancy and no electric space heat.
Example:
- mild month: 480 kWh over 30 days = 16 kWh/day;
- summer month: 1,200 kWh over 30 days = 40 kWh/day;
- estimated seasonal increment: 24 kWh/day.
The 24 kWh/day increment includes cooling and summer-specific loads such as pool pumps, dehumidifiers, irrigation pumps, extra refrigeration, and more hot-water or laundry use. It is not automatically all AC.
ENERGY STAR's Home Energy Yardstick similarly uses 12 months of bills and considers weather, home size, and occupants when comparing homes. A single bill cannot provide that context.
The 60-Minute Diagnosis Tree
Follow this order:
Minutes 0–10: Billing facts
- compare billing days;
- confirm actual versus estimated read;
- compare kWh/day;
- identify rate, tier, and fixed-charge changes;
- check budget-billing reconciliation or arrears;
- verify solar export credits if applicable.
Minutes 10–20: Weather and household changes
- compare outdoor temperature and humidity;
- note thermostat settings and schedule;
- list guests, work-from-home changes, vacations, or closed windows;
- list new EV, hot tub, pool, freezer, dehumidifier, server, or portable AC;
- note construction or a newly finished room.
Minutes 20–35: Utility interval data
- inspect daily totals;
- compare weekday and weekend shapes;
- look at overnight minimum load;
- find the date the increase began;
- identify long plateaus, repeated compressor cycles, or continuous loads;
- compare a cooler day with a hotter day.
Minutes 35–50: Safe physical checks
- inspect and replace a dirty filter with the correct type;
- confirm supply and return grilles are open and unobstructed;
- check thermostat mode and schedule;
- look for ice, unusual water, noise, or error messages without opening equipment;
- clear loose outdoor debris while preserving manufacturer clearances and power safety;
- check pool, spa, irrigation, dehumidifier, and water-heater schedules;
- feel for obvious hot-water leaks and verify no tap runs.
Minutes 50–60: Escalation decision
- call the utility for meter, estimated-read, tariff, or interval-data questions;
- call HVAC service if cooling runs unusually long, fails to hold temperature, freezes, leaks, trips breakers, or makes abnormal noise;
- call an electrician for suspected persistent electrical load, heat, odor, arcing, or safety concerns;
- request an energy audit when envelope and distribution causes remain unclear.
Read the Interval-Data Shape
Hourly or 15-minute utility data can turn guesses into hypotheses.
Weather-following afternoon load
Usage rises as outdoor temperature and solar gain rise, peaks in afternoon or early evening, and falls overnight. Cooling is a likely driver. Compare thermostat, shade, attic, duct, and equipment performance.
High flat load all day and night
A near-constant increase points toward a steady load: pool pump, dehumidifier, well or sump issue, electric water leak, extra refrigerator, server, resistance heater, or equipment fault. Multiply the approximate kW by 24 hours to estimate daily energy.
For example, a continuous 1 kW load uses 24 kWh/day. At $0.18/kWh, that is $4.32/day, about $130 over 30 days.
Sharp new overnight block
This may be EV charging, water heating, battery charging, a pool schedule, or time-shifted appliances. Check start date and equipment logs.
Rapid cycling pattern
Repeated short cooling calls can reflect oversized equipment, thermostat location, control settings, airflow, or other faults. Utility resolution may be too coarse to diagnose; a technician needs operating measurements.
One-day step change that never returns
List everything installed, adjusted, or failed on that date. A timer reset after an outage is common. So is a thermostat schedule change.
Use the smart-meter data guide to compare shapes without treating appliance-disaggregation guesses as measurements.
Cooling Load or Cooling Fault?
Hotter weather legitimately increases runtime. A fault is more likely when energy rises out of proportion to weather or comfort worsens at the same time.
Signs of expected weather load
- the home maintains the target temperature;
- runtime tracks outdoor heat and humidity;
- supply air feels consistently cooler than return air;
- energy falls on cooler days;
- no ice, water, error, or unusual sound appears;
- the thermostat schedule has not unexpectedly changed.
Signs that service may be needed
- the system runs continuously in moderate weather and cannot maintain temperature;
- airflow is weak at many registers;
- indoor coil or refrigerant line area ices—use the frozen evaporator-coil guide to separate airflow from refrigerant causes;
- condensate overflows or humidity rises—trace the pan, risk, drain, pump, and float controls with the condensate leak guide;
- breakers trip;
- compressor or fan starts and stops abnormally;
- one component runs while another does not;
- the outdoor coil is severely obstructed;
- utility data shows a new pattern unrelated to weather.
ENERGY STAR's maintenance checklist calls for checking controls, electrical connections, condensate drainage, coils, refrigerant level, blower components, and airflow. Refrigerant and electrical work require qualified service.
Filter and Airflow: Use the Correct Product
DOE and ENERGY STAR recommend regular filter inspection, especially during heavy-use months. A dirty filter can reduce airflow and increase runtime. The answer is not always the highest MERV filter that fits physically.
Use the equipment or contractor-approved filter size and performance. A restrictive filter in an undersized rack can create pressure problems even when clean. Note the replacement date and compare system behavior.
If airflow complaints persist, request total external static pressure, filter and coil pressure drops, blower setting, and delivered airflow. Do not accept a diagnosis based only on filter appearance.
The HVAC static-pressure guide explains those measurements.
Thermostat Changes That Matter
DOE advises setting the thermostat at a comfortable temperature that provides needed humidity control and notes that a smaller indoor-outdoor temperature difference lowers cooling cost. Setting a conventional system far colder does not cool the house faster.
Check:
- cooling versus fan-only mode;
- fan set to Auto rather than continuous On unless continuous circulation is intentional;
- hold settings and vacation overrides;
- smart-recovery behavior;
- remote sensors and room priority;
- thermostat exposure to lamps, televisions, sunlight, supply air, or warm wall cavities;
- dehumidification settings that may overcool;
- heat-pump or dual-fuel configuration after service.
Make one controlled change at a time. Record indoor comfort, humidity, runtime, and kWh/day for several comparable weather days.
Ducts, Attics, and Solar Gain
A cooling system can operate correctly while the house gains too much heat or loses conditioned air.
Common drivers include:
- leaky supply ducts in an attic or crawlspace;
- return leakage drawing hot, humid, or contaminated air;
- damaged or missing duct insulation;
- low attic insulation;
- open attic bypasses;
- west-facing glass without effective shading;
- dark roof and limited roof ventilation where applicable;
- disconnected bath exhaust dumping humidity into attic;
- closed bedroom doors without return paths.
DOE recommends window coverings to limit daytime heat gain and keeping registers unobstructed. Diagnose before buying windows or applying a radiant-barrier sales claim to every climate.
For distribution, use the duct leakage testing guide. For the envelope investment, use the insulation payback guide.
Summer Loads That Masquerade as Air Conditioning
Pool and spa equipment
Pump speed, schedule, filtration needs, heater operation, covers, and a failed timer can dominate summer use. Record nameplate power and actual schedule. Variable-speed pumps can reduce power at lower flow, but water-quality requirements and local rules govern operation.
Electric water heating
Guests, more showers, a leaking hot-water line, failed mixing valve, recirculation schedule, or resistance-element issue can increase use. A hot-water leak wastes both water and energy.
Dehumidifiers
Portable dehumidifiers add heat to the room while removing moisture. Continuous operation can indicate basement moisture entry, an oversized or poorly controlled AC, duct leakage, or an unrealistic setpoint.
Extra refrigeration
Garage refrigerators and freezers work harder in hot spaces. Dirty coils, poor door seals, little ventilation clearance, or a failing unit increase consumption.
EV charging
Summer road trips or a new vehicle can add a visible overnight block. Compare charger records with utility data and include charging losses.
Pumps and heaters
Well pumps, sump pumps, sewage pumps, heat tape, aquarium heaters, and irrigation can run unexpectedly because of leaks, stuck controls, or seasonal conditions.
Portable and window air conditioners
Multiple room units can consume more than expected. Single-hose portable units can draw conditioned air from the room and pull warm outdoor air through leaks. Check window sealing and condensate management.
For a new or poorly performing window unit, use the room-load and installation worksheet to separate capacity, solar load, air distribution, window leakage, electrical supply, and drainage before blaming the utility bill.
For a portable unit, compare regulated SACC, duct configuration, window-panel leakage, hose heat, and condensate with the single- versus dual-hose portable AC guide.
A Safe Baseload Test
If utility data shows high overnight use, inventory always-on loads. Do not switch off medical, safety, sump, refrigeration, or critical equipment.
Use device-provided monitoring or a plug-in meter only on compatible plug loads and within its rating. For hardwired circuits, use a qualified professional. Never remove a panel cover to attach consumer sensors unless you are authorized and competent for energized work.
Record:
| Load | Rated or measured watts | Hours/day | Estimated kWh/day |
|---|---|---|---|
| Dehumidifier | |||
| Pool pump | |||
| EV charging | |||
| Extra refrigerator/freezer | |||
| Server/network equipment | |||
| Water recirculation pump |
kWh/day = watts ÷ 1,000 × hours
Duty-cycling equipment does not draw nameplate power continuously. Measure or use runtime data where possible.
Solar Homes: Consumption and Purchases Are Different
With rooftop solar, the bill may show grid purchases and exports rather than total household consumption. A summer bill can rise because:
- solar production fell from shade, outage, dirt, clipping change, or inverter fault;
- household consumption rose;
- export credit changed;
- net-metering true-up occurred;
- time-of-use periods changed;
- battery reserve or charging settings changed.
Compare inverter production, household consumption, grid import, and export separately. A lower solar credit is not an air-conditioner failure. Verify meter and tariff dates with the utility.
Renters and Multifamily Homes
Renters can normalize bills, inspect accessible filters where responsible, check thermostat settings, report water leaks, and document interval data. Do not alter building equipment or sealing without permission.
In multifamily buildings, confirm which loads the meter serves. Common-area equipment, shared water heating, submetering, or billing allocation can complicate comparison. Ask the landlord or billing provider for the method in writing.
Document indoor temperatures and repair requests during heat events. Safety and habitability rules vary by jurisdiction; use local tenant resources when cooling or electrical conditions are unsafe.
When to Call the Utility
Contact the utility when:
- a read is estimated or appears inconsistent;
- meter replacement coincides with a step change;
- the rate plan, supplier, or tier changed unexpectedly;
- interval data is missing or timestamps look wrong;
- solar export or credit differs from the tariff;
- budget billing reconciled;
- an outage or billing correction created adjustments;
- usage remains implausible after known loads are documented.
Ask what meter test or dispute process is available. Do not assume a meter is wrong, but do not skip the billing evidence.
When to Stop and Get Technical Help
Seek prompt help for burning odor, hot electrical equipment, visible arcing, repeated breaker trips, damaged conductors, smoke, carbon-monoxide alarm, flooding near equipment, or loss of cooling that creates health risk.
HVAC service is appropriate for suspected refrigerant problems, ice, condensate issues, control faults, poor airflow, unusual current draw, compressor problems, or failure to maintain temperature. Request measurements and written findings, not only a replacement recommendation.
An energy audit is useful when bills are consistently high and no single fault explains them. Combine bill history, blower-door results, duct testing, insulation inspection, and equipment assessment.
Seven-Day Verification Plan
After correcting an obvious issue, measure the result.
- Save daily kWh and weather.
- Hold thermostat schedule stable.
- Record occupancy and large loads.
- Compare at least two similar-weather days before and after.
- Track indoor temperature and humidity.
- Avoid making several changes simultaneously.
- Review the next full bill for kWh/day and tariff, not just dollars.
Weather-normalized evidence is stronger than “the bill looked lower.”
Keep an Escalation Record
When the cause remains unclear, create a one-page record before calling the utility, landlord, or contractor:
- account and meter identifier with personal details redacted when shared;
- billing dates, days, kWh, and actual/estimated status;
- date the interval-data pattern changed;
- rate plan and relevant tariff line;
- thermostat schedule and indoor conditions;
- daily outdoor temperature or cooling degree days;
- new loads and occupancy changes;
- filter date and safe observations;
- photos of error messages, ice, water, or damaged equipment;
- prior service dates and work performed.
Ask each provider to document its finding. “Meter appears fine” is less useful than the test date, result, and next dispute step. “AC is old” is less useful than measured temperatures, airflow, static pressure, refrigerant diagnosis, current, and the fault that explains the new energy pattern.
For a rental, send repair observations through the owner's documented contact channel and keep timestamps. Do not diagnose energized building equipment yourself. The record helps separate a billing dispute, maintenance request, and health or safety escalation.
Frequently Asked Questions
Is a high summer bill usually the air conditioner?
Cooling is often the largest seasonal driver, but rate changes, longer billing periods, pools, dehumidifiers, EVs, water heating, and solar-credit changes can produce the same bill. Compare kWh/day and interval shape first.
How much electricity should my home use in summer?
There is no reliable universal number. Climate, home size, insulation, equipment, pool, occupancy, rate, solar, and thermostat all matter. Compare the home with itself across weather-normalized periods and use a tool such as ENERGY STAR's Home Energy Yardstick for broader context.
Why did my bill double when the thermostat stayed the same?
Hotter or more humid weather can create much longer runtime at the same setpoint. Rates or billing days may also change. A maintenance fault, duct leak, dirty filter, or added load is more likely when consumption rises beyond weather and comfort worsens.
Does lowering the thermostat cool the house faster?
Generally no for conventional systems. DOE warns that a colder setting can cause excessive cooling and unnecessary expense. Variable equipment may change output through its controls, but the setpoint is not a turbo button.
Can a dirty filter cause a high bill?
Yes, by restricting airflow and increasing runtime or contributing to faults. Use the correct filter and investigate system pressure if the issue persists.
What does a high overnight load mean?
It points toward continuous or scheduled equipment rather than solar heat gain: EV charging, pool pump, water heating, dehumidifier, extra refrigeration, server, sump/well pump, or a fault. Match the timing with equipment logs.
Should I turn breakers off to find the load?
Do not perform unsafe panel work or disable critical equipment. Utility interval data, device logs, compatible plug meters, and qualified electrical testing are safer. A breaker-off diagnostic should be planned by someone who understands the served loads and risks.
What to Read Next
Start with the electric-bill breakdown, then use the smart-meter data guide to locate the time pattern. If cooling follows the weather but costs too much, test the tariff with the utility rate-plan guide. For airflow or distribution symptoms, use the HVAC static-pressure guide and duct leakage guide.
Sources and Method
This workflow uses DOE summer-cooling guidance, ENERGY STAR maintenance and home-energy benchmarking resources, and EIA explanations of retail electricity prices. Examples are diagnostic illustrations, not claims about a particular utility or home. Verify rates, billing rules, weather, equipment, and safety requirements locally.
Sources and Verification
Editorial Review
EnergyBS Editorial Team
EnergyBS publishes practical homeowner guides. Important program, product, and cost claims should be checked against the linked source and local project documents before you commit to work.
Related Guides
View All ArticlesHow to Read Your Electric Bill: Every Line Item Explained (2026)
Your electric bill is full of confusing charges, fees, and acronyms. Here's a linebyline breakdown of what you're actually paying for—and where to find savings.
How to Read Your Smart Meter: Access Hidden Energy Data (2026)
Your smart meter records your energy usage every 15 minutes. Here's how to access that data and use it to find efficiency opportunities.
Electricity Rate Plans Explained: Compare Flat, Tiered, TOU, Dynamic, and Supplier Offers
A billfirst framework for comparing flat, tiered, timeofuse, criticalpeak, realtime, demand, EV, and retailsupplier plans without relying on headline cents per kWh.